









A 400 Bad Request error means the server could not understand the request your browser sent, usually because of a malformed URL, corrupted cookies or cache, an oversized request header, or an upload that is too large. To fix it, check the URL, clear cookies and cache for that site, and test in an incognito window.
Last updated 7 October 2026.
If you run a WordPress site, a 400 error is frustrating because the page simply refuses to load and the message says almost nothing. The server responds with HTTP status 400 and, in most cases, the cause sits on the browser or request side rather than in your hosting.
This guide explains what the error means, what each variation looks like, seven fixes for visitors, five server-side checks for site owners, and how to debug a 400 from a REST or API request. Every limit and default value quoted below comes from the official nginx, Apache, PHP or MDN documentation.
What Is a 400 Bad Request Error?

Here is how a 400 Bad Request page looks in the Google Chrome browser
The HTTP 400 Bad Request status code means the server would not process the request because of something it considered a client error. According to the MDN reference for 400 Bad Request, the usual reasons are malformed request syntax, invalid request message framing, or deceptive request routing. MDN also notes that repeating the request without changing anything will fail with the same error, which is why the fixes below all change something about the request.
It belongs to the 4xx family of client errors, which signal a problem with the request rather than a crash on the server.
What a 400 Bad Request Error Looks Like
Different servers and browsers word the same status differently. These are the messages you are most likely to see:
400 Bad RequestorHTTP Error 400, the generic wordingBad Request - Your browser sent a request that this server could not understand, common on Apache400 Bad Request: Request Header Or Cookie Too Large, common on nginx, covered in the server checks belowBad Request - Invalid URL, which points at the address you typed400. That's an error. Your client has issued a malformed or illegal request. That's all we know., the wording on Google’s own pages
400 vs Other 4xx Status Codes
Several nearby codes look similar but need different fixes. This table uses the definitions from MDN so you can tell them apart quickly:
| Code | Name | What it means | Typical fix |
|---|---|---|---|
| 400 | Bad Request | The server would not process the request because of a client error such as malformed syntax | Fix the URL, clear cookies and cache, check the request body |
| 403 | Forbidden | The server understood the request but refuses to process it | Check permissions and security rules |
| 404 | Not Found | The server cannot find the requested resource | Fix the link or add a redirect |
| 413 | Content Too Large | The request body is larger than the limit the server defines | Upload a smaller file or raise the server limit |
| 414 | URI Too Long | The requested URI is longer than the server is willing to interpret | Shorten the URL or send data in the request body |
| 431 | Request Header Fields Too Large | The request headers are too long, in total or in a single field | Clear cookies or raise the header limit |
You can find the full list of client error codes in the MDN HTTP status reference.
Are you facing permission access issues on the website? Here is a quick guide on how to Fix the "Sorry You Are Not Allowed to Access This Page" Error.
What Causes the 400 Bad Request Error?
A 400 usually comes from something in the request your browser or app sends. The most common causes are:
- Corrupted browser cache or cookies: Damaged or expired data can make the server misread the request.
- A malformed URL: Typos, illegal characters, or bad encoding in the address.
- Cookies or headers that are too large: Many cookies pile up until the request header passes the server limit.
- A file that is too large: An upload that exceeds the server or PHP limit can be rejected.
- Outdated local DNS data: Your device may still point at old routing information.
- A conflicting browser extension: Poorly coded extensions can alter requests.
- An invalid request body: A form, plugin or API client sending broken JSON or missing fields.
- Server rules: A firewall, WAF or security plugin rejecting a request it considers invalid.
7 Proven Ways to Fix a 400 Bad Request Error
Start with the quick browser-side fixes below. They solve most cases, and each one takes under a minute.
1. Use Another Browser or an Incognito Window
The first step is to rule out your browser. Open the same URL in a different browser, or in an incognito or private window, which loads the page without your stored cookies and extensions.
If the page works there, the problem is local to your main browser: reset its settings, disable extensions, or reinstall it. If the page fails everywhere, move on to the next fixes.
2. Verify the URL
If the site fails in every browser, check the address. It is easy to mistype a URL, and invalid characters or broken encoding trigger a 400.
Look for typos, a missing or doubled slash, spaces, and special characters such as % in the wrong place. A stray % that is not followed by two hexadecimal digits is a classic cause of a malformed request.

3. Refresh the Page
A hard refresh tells the browser to ignore the cached copy of the page and request fresh files from the server. These are the common shortcuts:
- Chrome on Mac: Command + Shift + R
- Google Chrome on Windows: Ctrl + F5 or Ctrl + Shift + R
- Safari: Command + Option + R
- Firefox on Windows: Ctrl + F5
- Firefox on Mac: Command + Shift + R
- Microsoft Edge: Ctrl + F5
4. Delete the Browser Cache
Your browser stores website files locally so repeat visits load faster. If any stored file is corrupted, it can lead to browser errors, so clearing the cache is a standard fix. In Google Chrome:
- Click the three-dot icon in the top right corner of Chrome.

- Go to Settings > Privacy and Security > Clear Browsing Data.

- In the popup, check Cached images and files and click Clear data.

After clearing the cache, load the site again. If the error persists, continue with the next method.
Improve your site’s performance and caching storage with a WordPress caching plugin. Check out the 5 Best WordPress Caching Plugins to help speed up your site.
5. Check the File Size
Web servers cap the size of uploads. If you upload a file larger than the limit, the request can be rejected. Test with a smaller file: if it uploads, the original was too large and needs compressing.
To check the limit in WordPress, go to Media > Add New in the dashboard and read the maximum upload file size shown on the page. The server checks below explain how that limit is set and how to raise it.

Worried about blurred images on your website? Learn How to Fix Blurry Images in WordPress with 6 Proven Methods.
6. Disable Browser Extensions
Extensions add features to your browser, but a poorly coded one can alter or break requests and cause a 400. Turn them off temporarily to test. In Google Chrome:
- Click the three dots in the top right corner and open Extensions.

- Review the list of active extensions.
- Turn the toggle off for each extension.
- Reload the page.
If the error disappears, re-enable the extensions one at a time and refresh after each to find the culprit. Update it, and if the problem remains, remove it.
7. Remove Corrupted or Invalid Cookies
Cookies store session history, preferences and login details. Corrupted or outdated cookies can cause a 400. A site that sets too many cookies can also push the request header over the server limit, which produces the specific message 400 Bad Request: Request Header or Cookie Too Large.
To clear cookies in Google Chrome, go to Settings > Privacy and Security > Clear Browsing Data.

Check Cookies and other site data and click Clear data. If you only want to fix one site, open that site’s cookie settings and delete just its cookies so you stay logged in elsewhere.

Restart Chrome and visit your website to see whether the issue is resolved.
Bonus: Flush the DNS Cache
If none of the above works, your device may hold outdated DNS data. On Windows, open Command Prompt and run:
ipconfig /flushdnsThe command prints a confirmation that the DNS Resolver Cache was flushed. For macOS steps, see this guide to flushing the DNS cache on Windows and macOS.
Are you frustrated with your website issues? Here are the 10 Common WordPress Mistakes to Avoid (with Solutions).
For Site Owners: 5 Server-Side Checks for a 400 Error
If visitors report the error on several devices, or you see it yourself after clearing everything, the cause is likely on your server. These five checks cover the most frequent server-side reasons.
1. Raise the Request Header Limit
Servers limit how large a request header can be. According to the nginx documentation, a request header field larger than one buffer returns a 400 error, and the default is large_client_header_buffers 4 8k. A site that sets many cookies, or a login system that stores a large token, can cross that line. A request line that is too long returns 414 instead.
In nginx you can raise the buffer size, then reload the server:
# nginx.conf, inside the http or server block
large_client_header_buffers 4 16k;
Apache has an equivalent. The LimitRequestFieldSize directive limits the size of a request header field, and its default is 8190 bytes according to the Apache documentation:
# Apache server config or virtual host
LimitRequestFieldSize 16380
Raising limits hides the symptom, so also look at why the cookies grew. Several plugins and tracking scripts each setting cookies is a common reason.
2. Match Your Upload Limits
Upload limits exist at two levels, and they produce different errors. In nginx, a body larger than client_max_body_size (default 1m) returns 413, not 400. In PHP, upload_max_filesize (default 2M) caps a single file and post_max_size (default 8M) caps the whole request. The PHP manual states that post_max_size must be larger than upload_max_filesize to upload large files.
; php.ini
upload_max_filesize = 64M
post_max_size = 72M
Your host panel usually exposes these values. After changing them, the limit shown under Media > Add New in WordPress updates to the smaller of the relevant values.
3. Test for Plugin and Theme Conflicts
A security, firewall or optimization plugin can reject a request it considers invalid. Deactivate plugins in bulk, check whether the 400 disappears, then reactivate them one at a time. Switching temporarily to a default theme shows whether the theme is involved. Do this on a staging copy if the site is busy.
4. Regenerate Permalinks and .htaccess
A damaged rewrite rule can turn normal URLs into bad requests. In the WordPress dashboard, go to Settings > Permalinks and click Save Changes without editing anything. WordPress regenerates its rewrite rules, which fixes a corrupted .htaccess in many cases.
5. Check the CDN, Proxy and Server Logs
If a CDN or reverse proxy sits in front of your site, a rule there can reject requests before WordPress sees them. Pause the CDN or test the origin directly. Then read the web server error log, which usually states the exact reason, such as a header over the limit or an invalid request line.
For related permission problems, our guide to WordPress user roles and permissions explains who can do what in the dashboard.
For Developers: Debugging a 400 From a REST or API Request
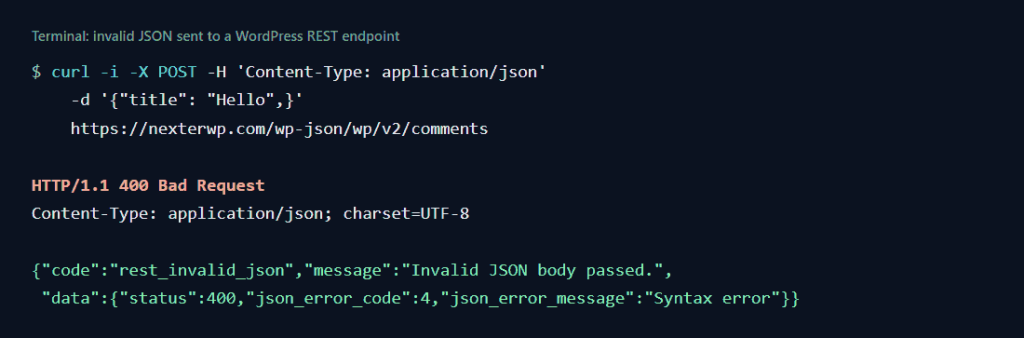
When the 400 comes from a script, plugin or API client rather than a browser page, the response body usually tells you exactly what is wrong. WordPress returns a JSON error with a machine-readable code. Sending invalid JSON to a REST endpoint is a quick way to see it:
curl -i -X POST -H 'Content-Type: application/json' \
  -d '{"title": "Hello",}' \
  https://example.com/wp-json/wp/v2/comments
The trailing comma makes the body invalid JSON, so the server answers with status 400 and a rest_invalid_json code, as in this real response from our own site:
A short checklist for API-related 400 errors:
- Read the response body, not only the status. The error code and message usually name the bad field.
- Validate the JSON and check that the
Content-Typeheader matches the body you send. - Confirm required parameters are present and use the expected types.
- Inspect the request in the browser with the Network panel in Chrome DevTools, which shows the exact headers and payload that were sent.
For more on working with WordPress endpoints, see our walkthrough of the WordPress REST API with real requests you can copy.
Stay updated with Helpful WordPress Tips, Insider Insights, and Exclusive Updates – Subscribe now to keep up with Everything Happening on WordPress!
Wrapping Up
A 400 Bad Request means the server rejected a request it could not process, and in most cases the fix is on the request side. Start with a different browser or an incognito window, check the URL, clear the cache and cookies for the site, and test your uploads. If the error follows you across devices, move to the server checks: header limits, upload limits, plugin conflicts, rewrite rules and your CDN.
If you use the Gutenberg editor to build your site, take a look at Nexter Blocks, a Gutenberg block toolkit that adds the layout and design blocks core does not include.

FAQs on Fixing 400 Bad Request Errors
Is the 400 Bad Request error a client-side or server-side issue?
It is usually a client-side issue, caused by the browser, the local device or the request itself. A misconfigured server can also return 400, for example when a request header exceeds its limit.
What are the common causes of a 400 Bad Request error?
Invalid request syntax, incorrect URL characters, corrupted or outdated cache and cookies, oversized cookies or headers, outdated DNS data, large uploads, conflicting extensions, and invalid request bodies are the common causes.
How do I fix a 400 Bad Request error on Google Chrome?
Check the URL, clear the cache and the cookies for that site, test in an incognito window, turn off extensions, and make sure any file you upload is within the size limit.
What does 400 Bad Request: Request Header or Cookie Too Large mean?
It means the request header sent by your browser, often because of many or large cookies, is bigger than the server allows. Clear the cookies for the site, or ask the site owner to raise the header buffer limit.
Is a 400 error permanent?
No. Repeating the same request will fail again, but changing something about the request, such as clearing cookies, correcting the URL or sending a smaller file, usually resolves it.
What is the difference between a 400 and a 413 error?
A 400 means the server could not process the request because of a client error such as malformed syntax. A 413 means the request body is larger than the limit the server allows, so it applies specifically to oversized uploads.
What are some best practices for avoiding a 400 bad request error?
Keep your browser updated, clear stale cookies and cache, disable faulty extensions, and check file sizes before uploading. Site owners should keep header and upload limits aligned and test plugins on staging.
Which tools can help me debug a 400 bad request error?
Browser developer tools such as Chrome DevTools show the request headers and payload. For APIs, curl or an API client shows the response body, which usually names the invalid field.
