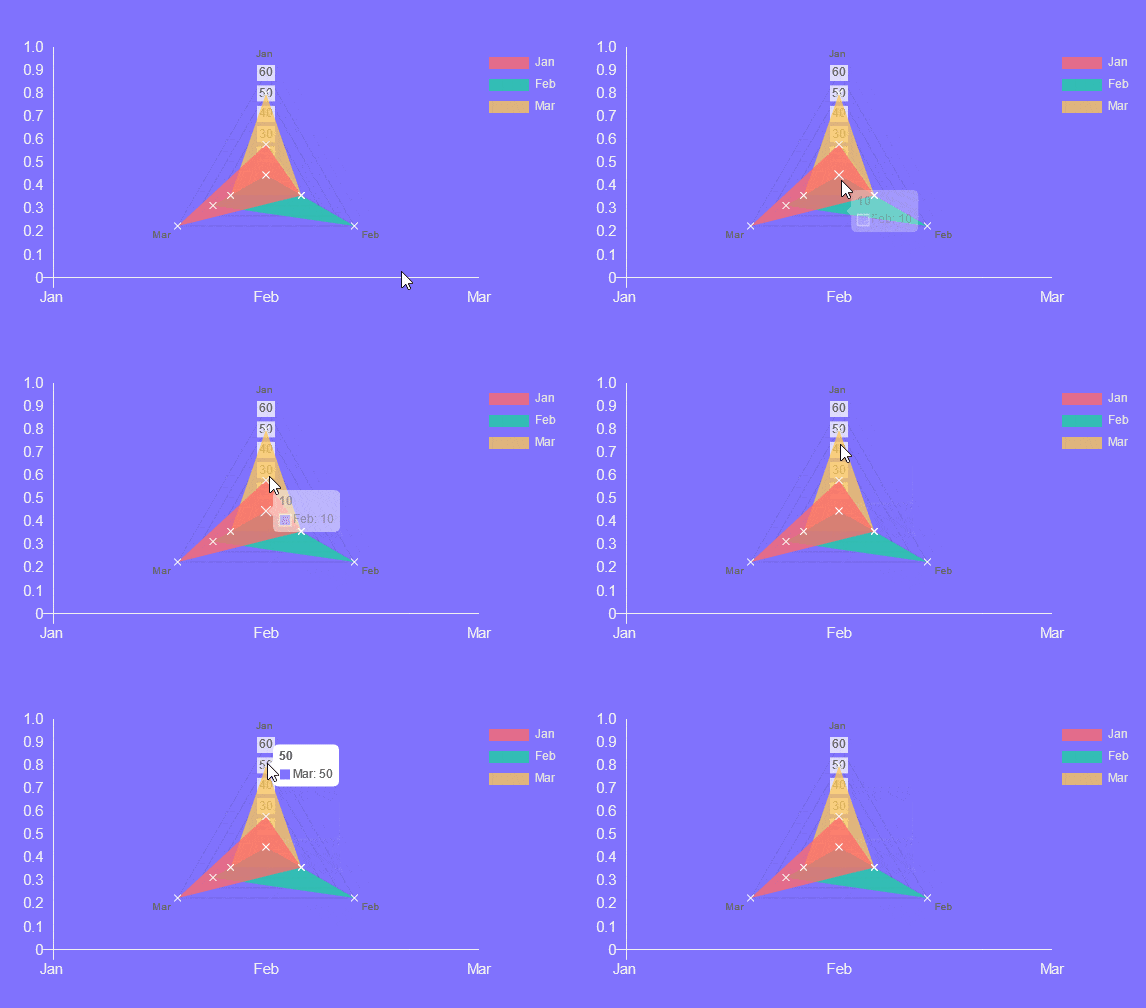
Do you want to create a radar chart in WordPress? Radar charts, also known as spider or web charts, are powerful visual tools for displaying multiple data points in a circular format. They’re often used in business and marketing presentations to compare different variables effectively.
With the Advanced Chart block from Nexter Blocks, you can easily convert your data into a radar chart on your WordPress website.
To check the complete feature overview documentation of the Nexter Blocks Advanced Chart block, click here.
Requirement – This block is a part of the Nexter Blocks, make sure it’s installed & activated to enjoy all its powers.
To do this, add the Advanced Chart block to the page and follow the steps –
1. Select Radar from the Style section under the Chart tab.

2. After that, in the Label Values field, you have to add chart labels separated by a pipe sign (|).
3. Then in the Dataset tab, you have to add the data for the chart. You’ll find the same options as for the Line chart.
You can customize the chart further from the Style tab. Here you’ll find the same options that are available for the Line chart.
Now you should have a beautiful interactive radar chart.


