Want to showcase your data in a clear and engaging way?
The Best Chart Plugins for WordPress help you turn boring numbers into interactive visuals that grab attention.
In this guide, you’ll discover the top options compared side by side so you can pick the perfect fit for your site.
Key Takeaways
- A chart helps you turn complex data into clear, visual insights your visitors can grasp instantly.
- Choose a chart plugin by checking factors like ease of use, customization options, responsiveness, and integration with your data sources.
- Pick Chart by Nexter as your go-to plugin because it delivers powerful features, smooth performance, and stunning visuals for any WordPress site.
What is a Chart in WordPress?
A chart in WordPress lets you turn raw numbers into clear, visual stories that your visitors can quickly understand.
You use it to present data in engaging formats like bars, lines, or pie charts, making complex information easy to digest.
Best Chart Plugins for WordPress Compared
| Sl No | Chart Plugin | Rating |
|---|---|---|
| 1 | Chart by Nexter | ★★★★★ |
| 2 | Chartify | ★★★★ |
| 3 | Visualizer | ★★★ |
| 4 | iChart | ★★★ |
| 5 | amCharts | ★★★ |
1. Chart by Nexter

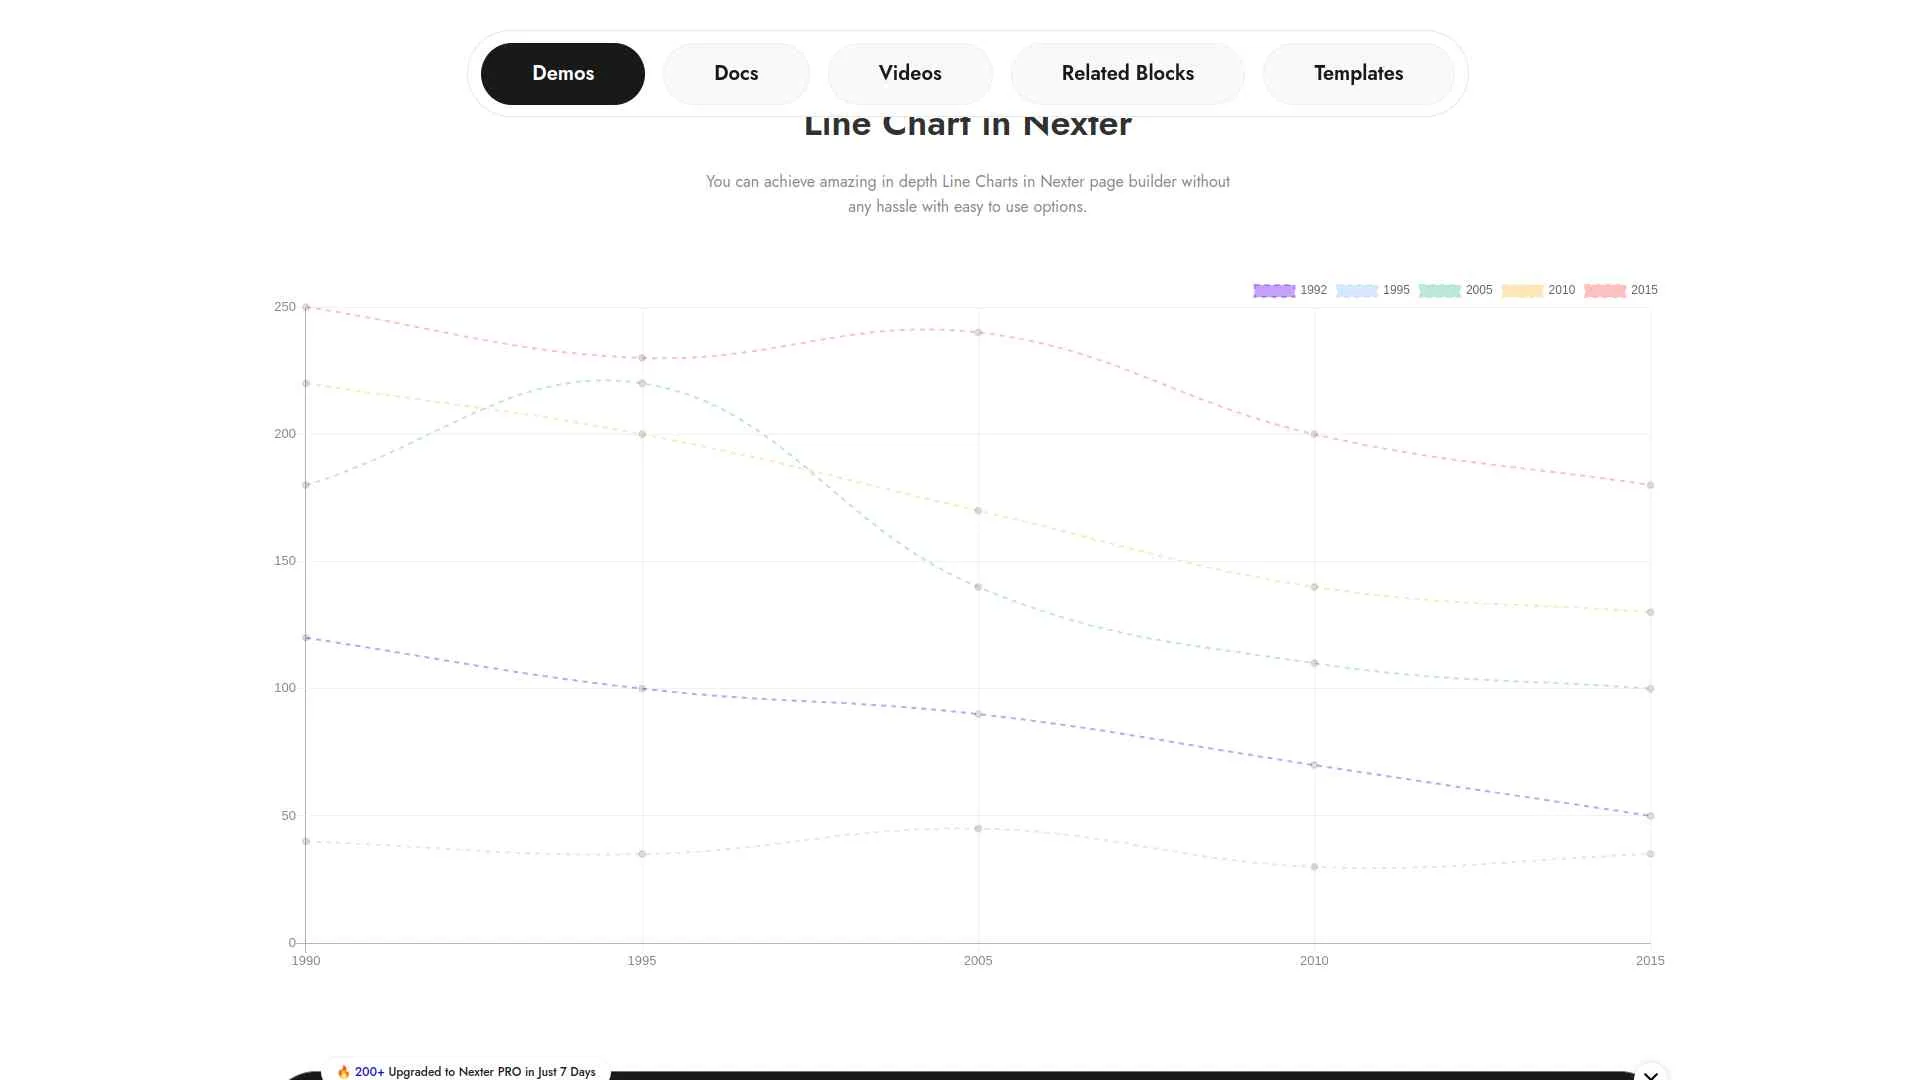
You can easily create advanced, customizable charts and graphs in WordPress using the Nexter Blocks plugin, designed for speed and seamless integration with Gutenberg.
It lets you enable only the features you need, ensuring your site stays fast and efficient.
Key Features of Chart by Nexter
- Easily create beautiful, interactive charts and graphs right within the WordPress Gutenberg editor, no extra tools needed.
- Keep your website fast and smooth since the plugin only loads features you use, improving overall site performance.
- Use the license on multiple local or staging sites without extra cost, making testing and development hassle-free.
- Get reliable support and regular updates to ensure your charts stay secure and compatible with WordPress updates.
2. Chartify
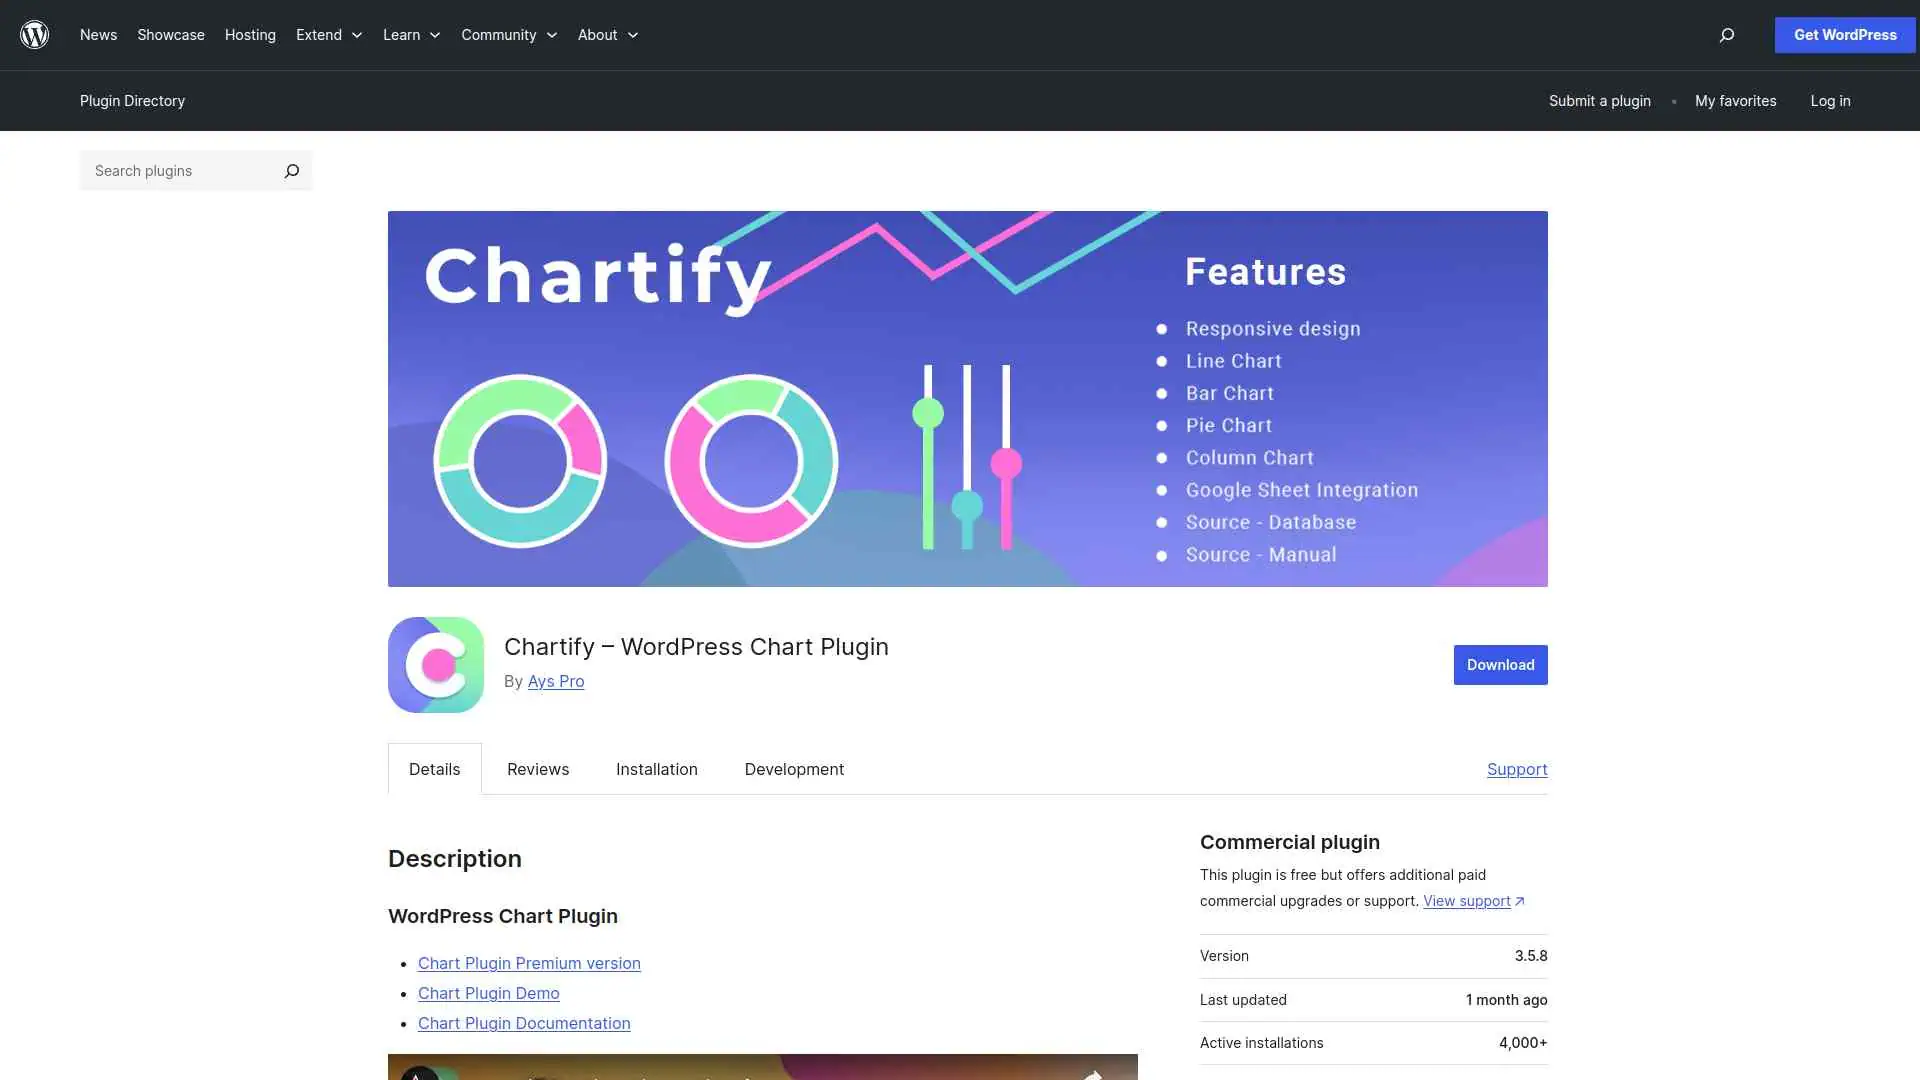
You can easily create responsive and dynamic charts on your WordPress site using the Chartify plugin.
It lets you build various chart types manually, from Google Sheets, or by querying your database, all with a user-friendly interface.
Key Features of Chartify
- Easily create beautiful and interactive charts on your WordPress site without needing any coding skills.
- Automatically update your charts when your Google Spreadsheet data changes, saving you time and effort.
- Show a wide variety of chart types to make your data clear and engaging for your visitors.
- Preview your charts live before publishing to ensure they look perfect on both desktop and mobile devices.
3. Visualizer
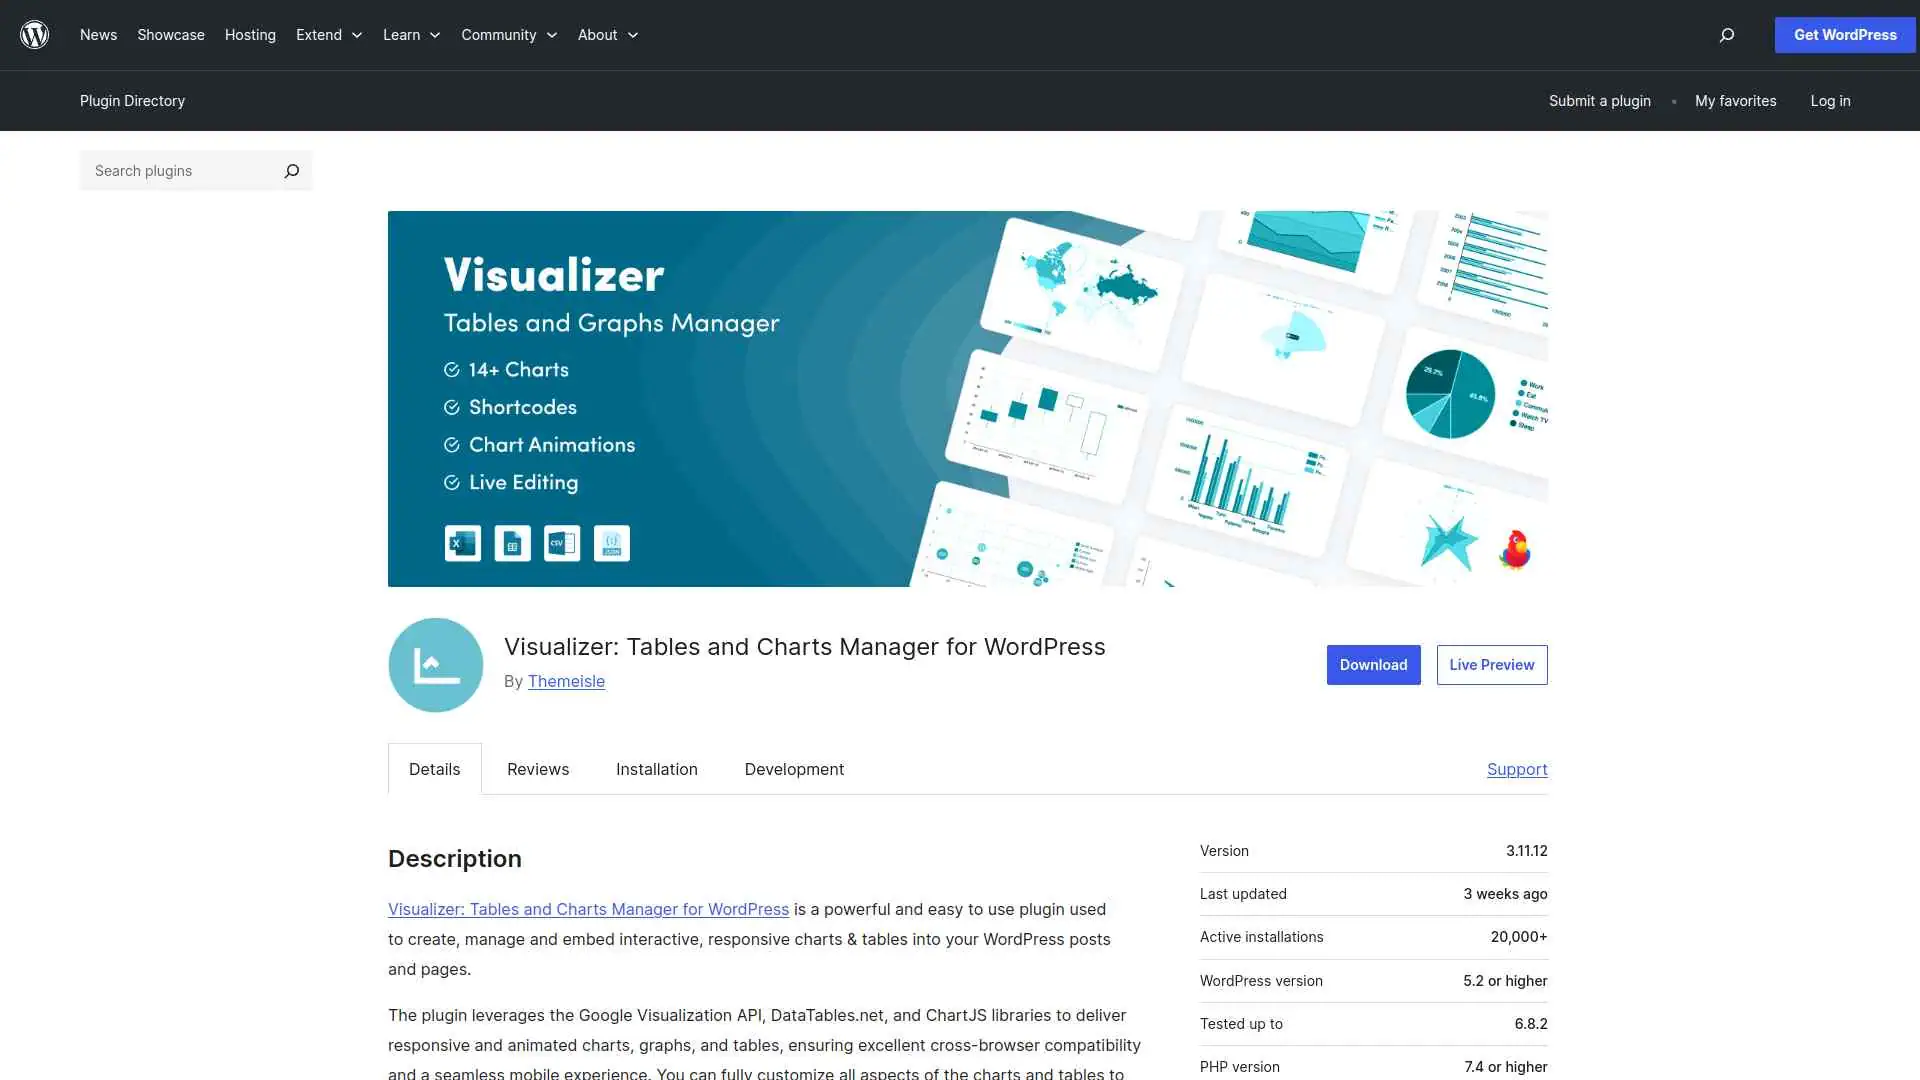
You can use the Visualizer plugin to easily create and embed interactive, responsive charts and tables in your WordPress posts and pages.
It offers a variety of customizable chart types and ensures your data looks great on any device.
Key Features of Visualizer
- Easily create and embed responsive charts and tables on your WordPress site to make your data visually appealing.
- Support for multiple chart types helps you present information in the best way for your audience.
- Simple to use, so you can quickly add professional-looking data visualizations without needing technical skills.
- Enhances your website’s content by making complex data easier to understand and more engaging for visitors.
4. iChart
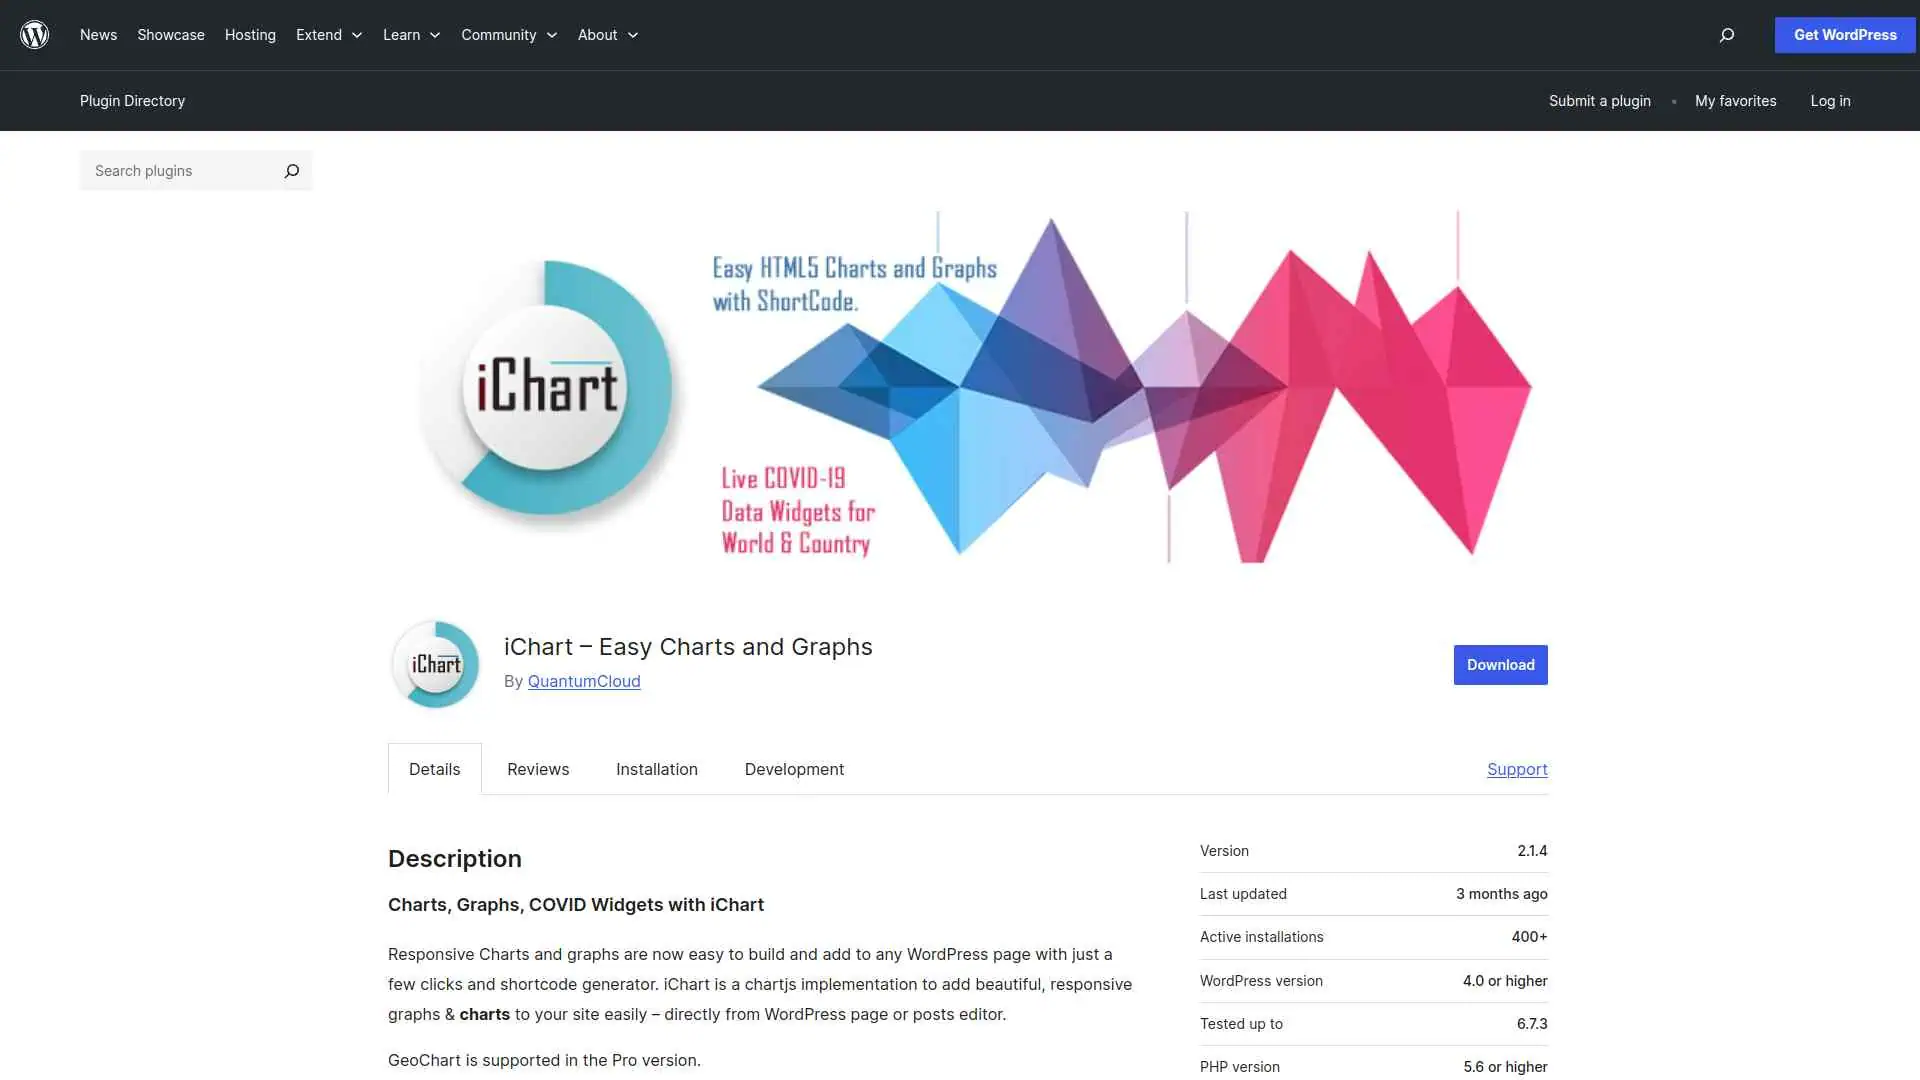
You can easily create and embed responsive, animated charts and graphs directly within your WordPress posts or pages using iChart’s shortcode generator.
It supports multiple chart types like pie, bar, line, and GeoCharts, making your data visualization simple and beautiful.
Key Features of iChart
- Easily create beautiful, responsive charts and graphs directly within your WordPress posts or pages without needing coding skills.
- Display multiple types of charts (like pie, bar, line, radar) on the same page to clearly visualize different sets of data.
- Customize colors, sizes, and styles of charts to match your website’s look and make your data stand out.
- Use the shortcode generator and Gutenberg blocks for quick, hassle-free insertion and editing of charts anytime.
5. amCharts
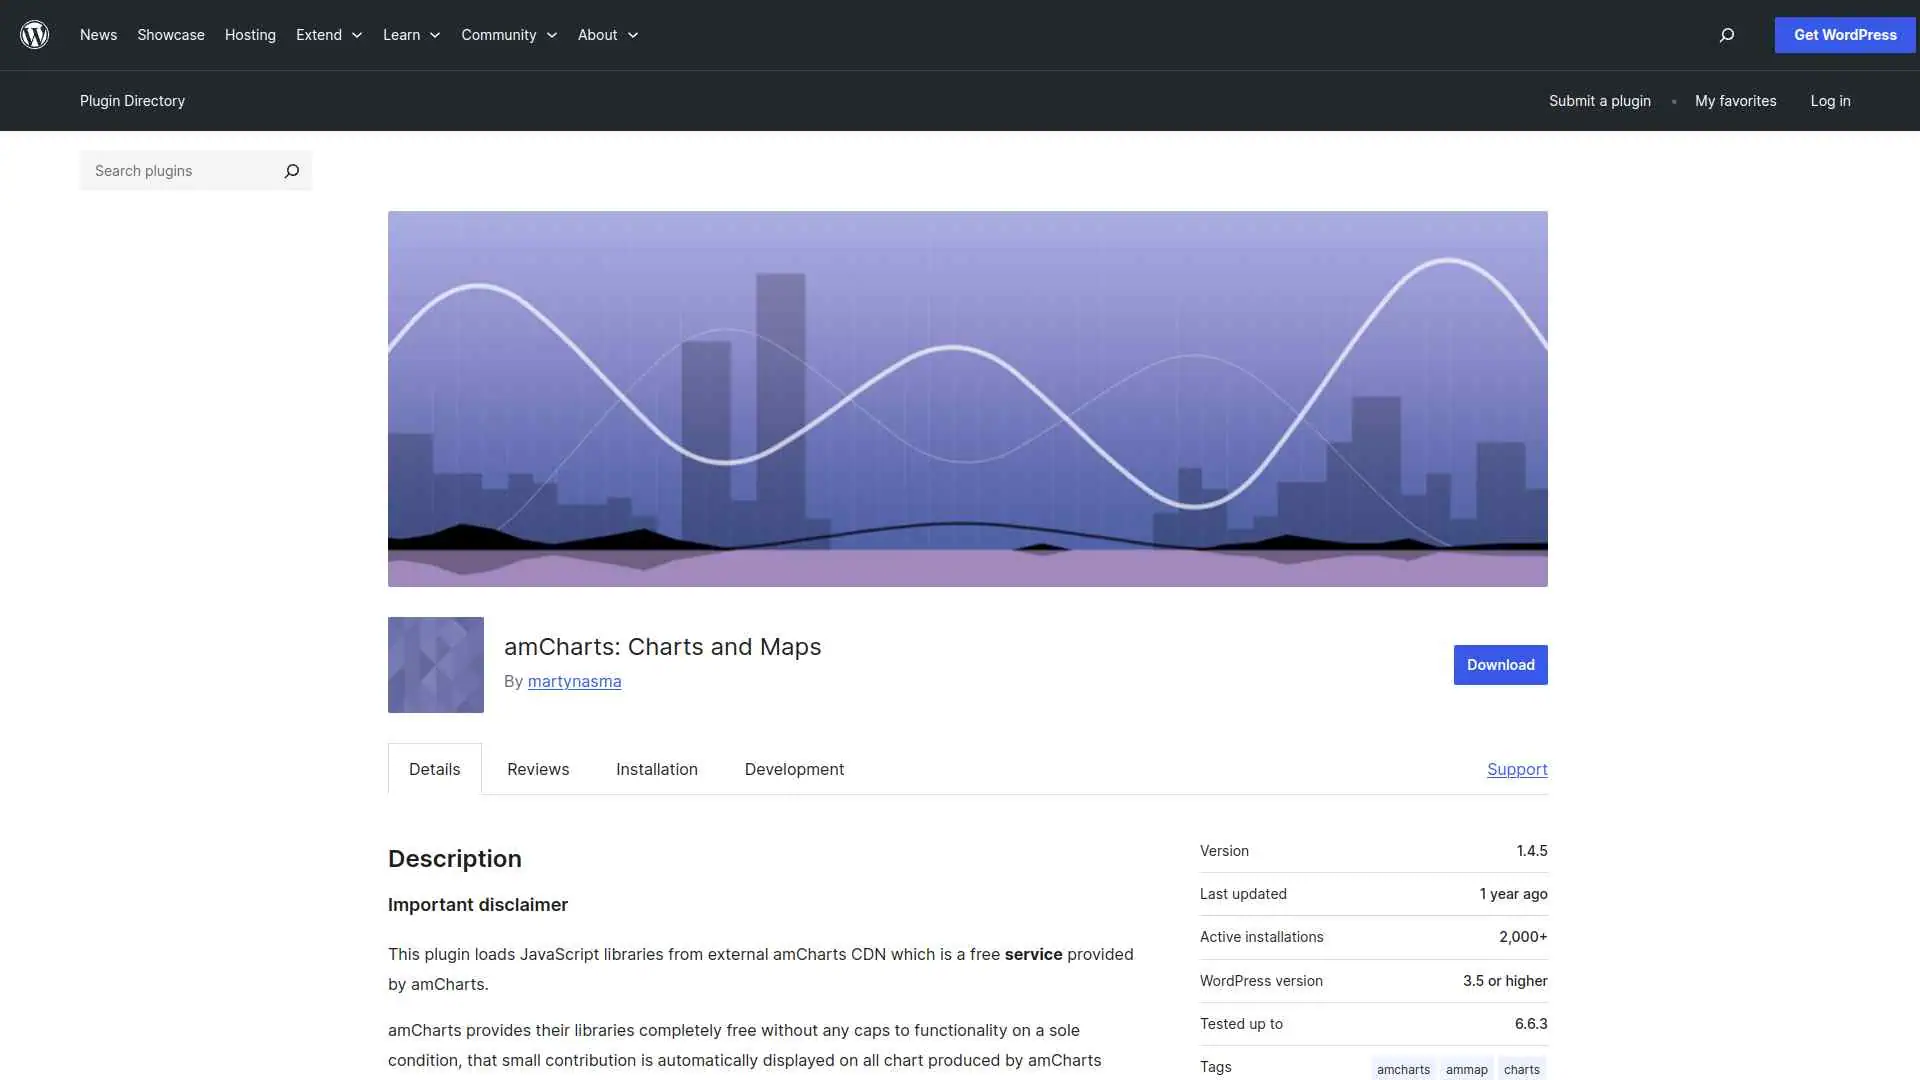
You can easily add interactive charts and maps to your WordPress site using the amCharts plugin, which loads powerful amCharts libraries from their CDN.
It lets you insert charts via shortcodes or PHP, automatically includes only needed scripts, and supports customization and multilingual sites.
Key Features of amCharts
- Easily add interactive charts and maps to your WordPress posts or pages without worrying about complex coding.
- Use simple shortcodes or PHP functions to insert charts anywhere on your site, making customization quick and flexible.
- Automatically loads only the necessary chart libraries, keeping your site fast and lightweight.
- Supports multiple languages with WPML, so your charts can adapt to your site’s language for a better user experience.
Stay updated with Helpful WordPress Tips, Insider Insights, and Exclusive Updates – Subscribe now to keep up with Everything Happening on WordPress!
Which WordPress Chart Plugin Should You Use?
When choosing a chart plugin, focus on ease of use, customization, and how well it integrates with your workflow.
Pick a tool that makes your data clear and engaging for your audience.

If you want a powerful, flexible, and future-ready option, Chart by Nexter is your best choice.
FAQs on Best Chart Plugins for WordPress
Do WordPress chart plugins work with any theme?
Yes, most chart plugins work with any modern WordPress theme. You just need to insert the chart shortcode or block, and it will adapt to your theme’s design without breaking your layout.
Can you customize the look of charts in WordPress?
Absolutely! You can adjust colors, labels, fonts, and chart types. Most plugins give you simple settings or drag‑and‑drop options, so you can match charts to your site’s branding without coding.
Do you need coding skills to use chart plugins?
No, you don’t. Most chart plugins let you create and manage charts visually. You can upload data, choose chart styles, and publish them with a few clicks, making them beginner‑friendly.
Can you update chart data after publishing?
Yes, you can. Simply edit the chart’s data source or table, and the chart will update automatically on your site. This makes it easy to keep your visuals accurate and current.
Will charts slow down your WordPress site?
Not if you use them wisely. Charts are lightweight, but adding too many on one page may affect performance. To keep your site fast, optimize images, use caching, and limit heavy scripts.

