Want to showcase your data in a clear and engaging way?
The Best Pie Chart Plugins for WordPress help you turn boring numbers into interactive visuals that grab attention.
In this guide, you’ll discover the top tools to create stunning pie charts effortlessly.
Key Takeaways
- A pie chart visually shows parts of a whole, making data easy to compare at a glance.
- Look for plugins that offer customization, responsive design, ease of use, and smooth integration with your WordPress setup.
- Choose Pie Chart by Nexter for the best balance of features, performance, and simplicity.
What is a Pie Chart in WordPress?
A pie chart in WordPress lets you visually display data as slices of a circle, making complex numbers easy to understand.
You can use it to highlight proportions, compare categories, and present insights in a clear, engaging way.
Best Pie Chart Plugins for WordPress Compared
| Sl No | Pie Chart Plugin | Rating |
|---|---|---|
| 1 | Pie Chart by Nexter | ★★★★★ |
| 2 | iChart | ★★★★ |
| 3 | Easy Charts | ★★★ |
| 4 | Chartify | ★★★ |
| 5 | WP Charts and Graphs | ★★★ |
1. Pie Chart by Nexter

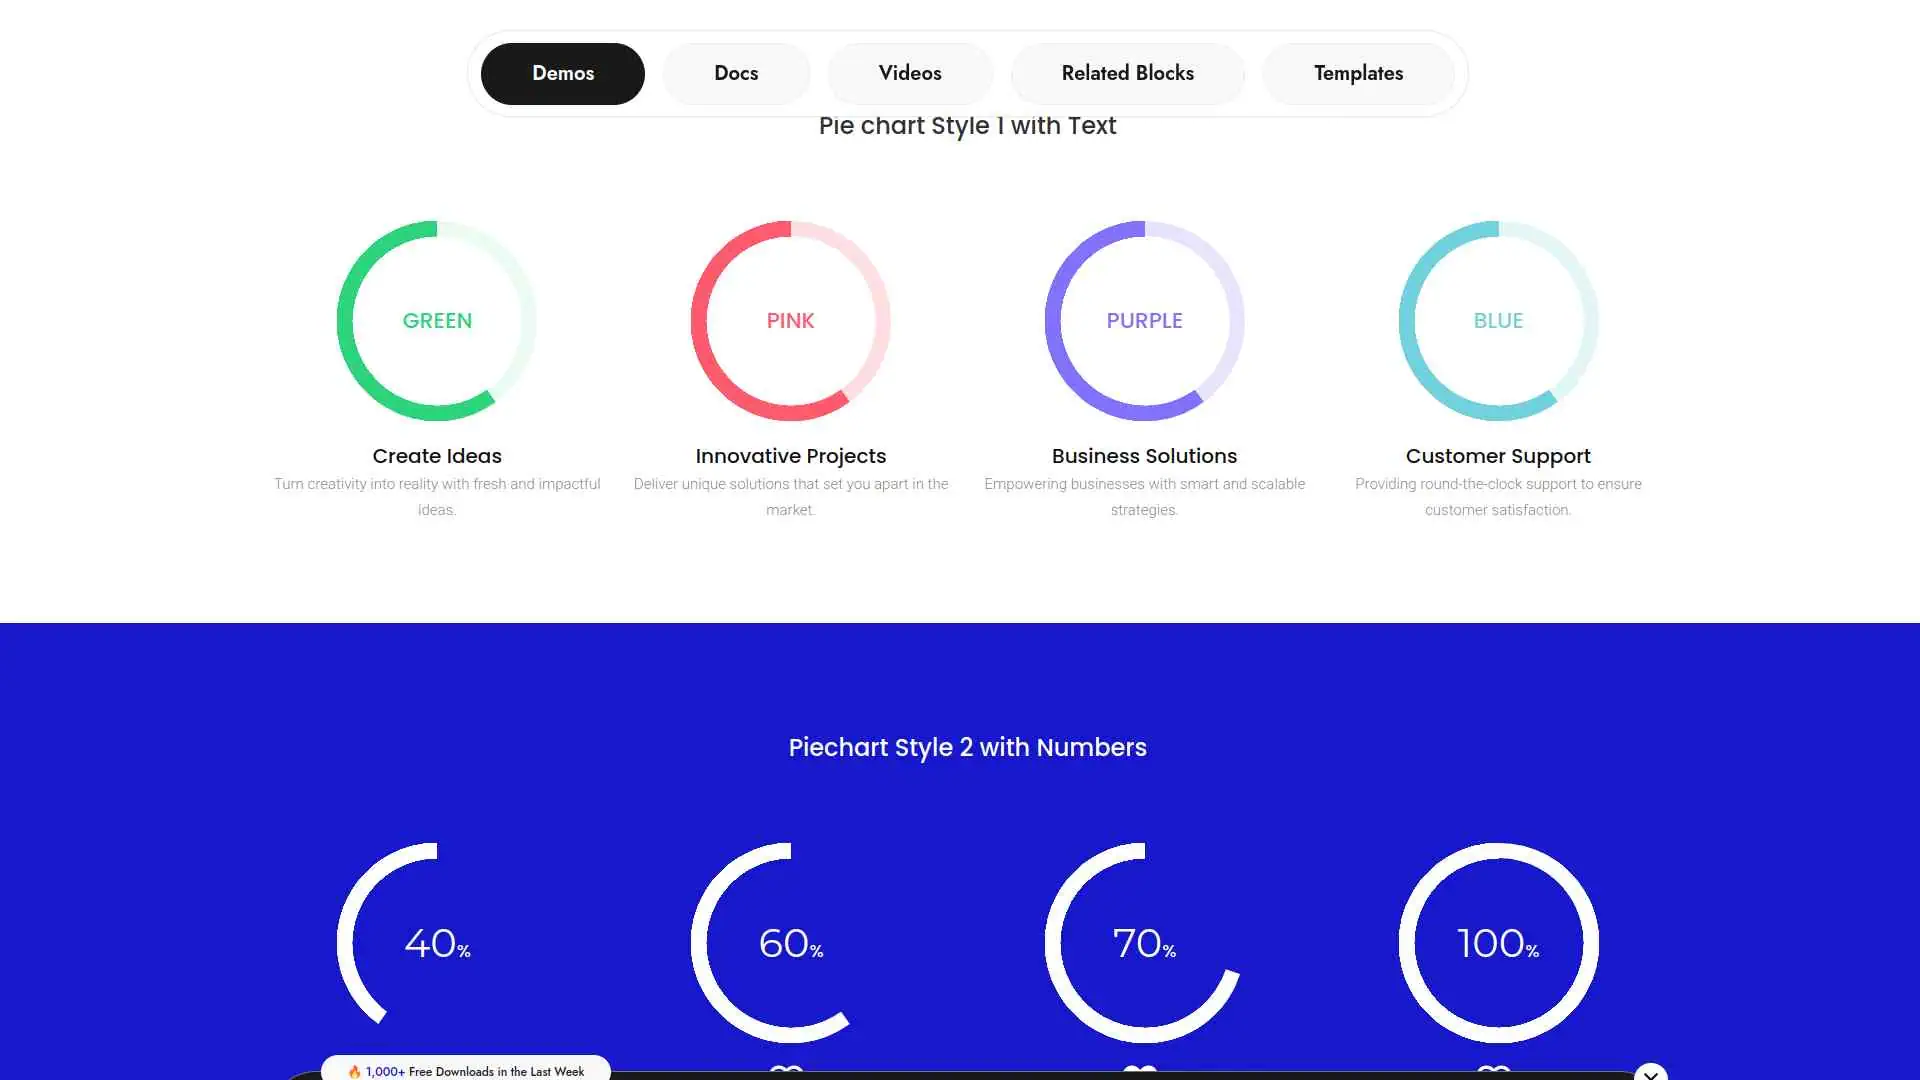
You can easily create interactive pie charts on your WordPress site using this plugin, customizing colors, labels, and legends to clearly display your data.
It’s designed for speed and performance, using pure Vanilla JS without jQuery, ensuring your site stays fast and smooth.
Key Features of Pie Chart by Nexter
- Easily create interactive and visually appealing pie charts to make your data clear and engaging for website visitors.
- Customize colors, labels, and legends to match your site’s style and highlight important information effectively.
- Enjoy fast website performance since the plugin is built for speed and only loads features you use, keeping your site quick.
- Get reliable support and updates with email renewal reminders and a flexible license that works on local and staging sites too.
2. iChart
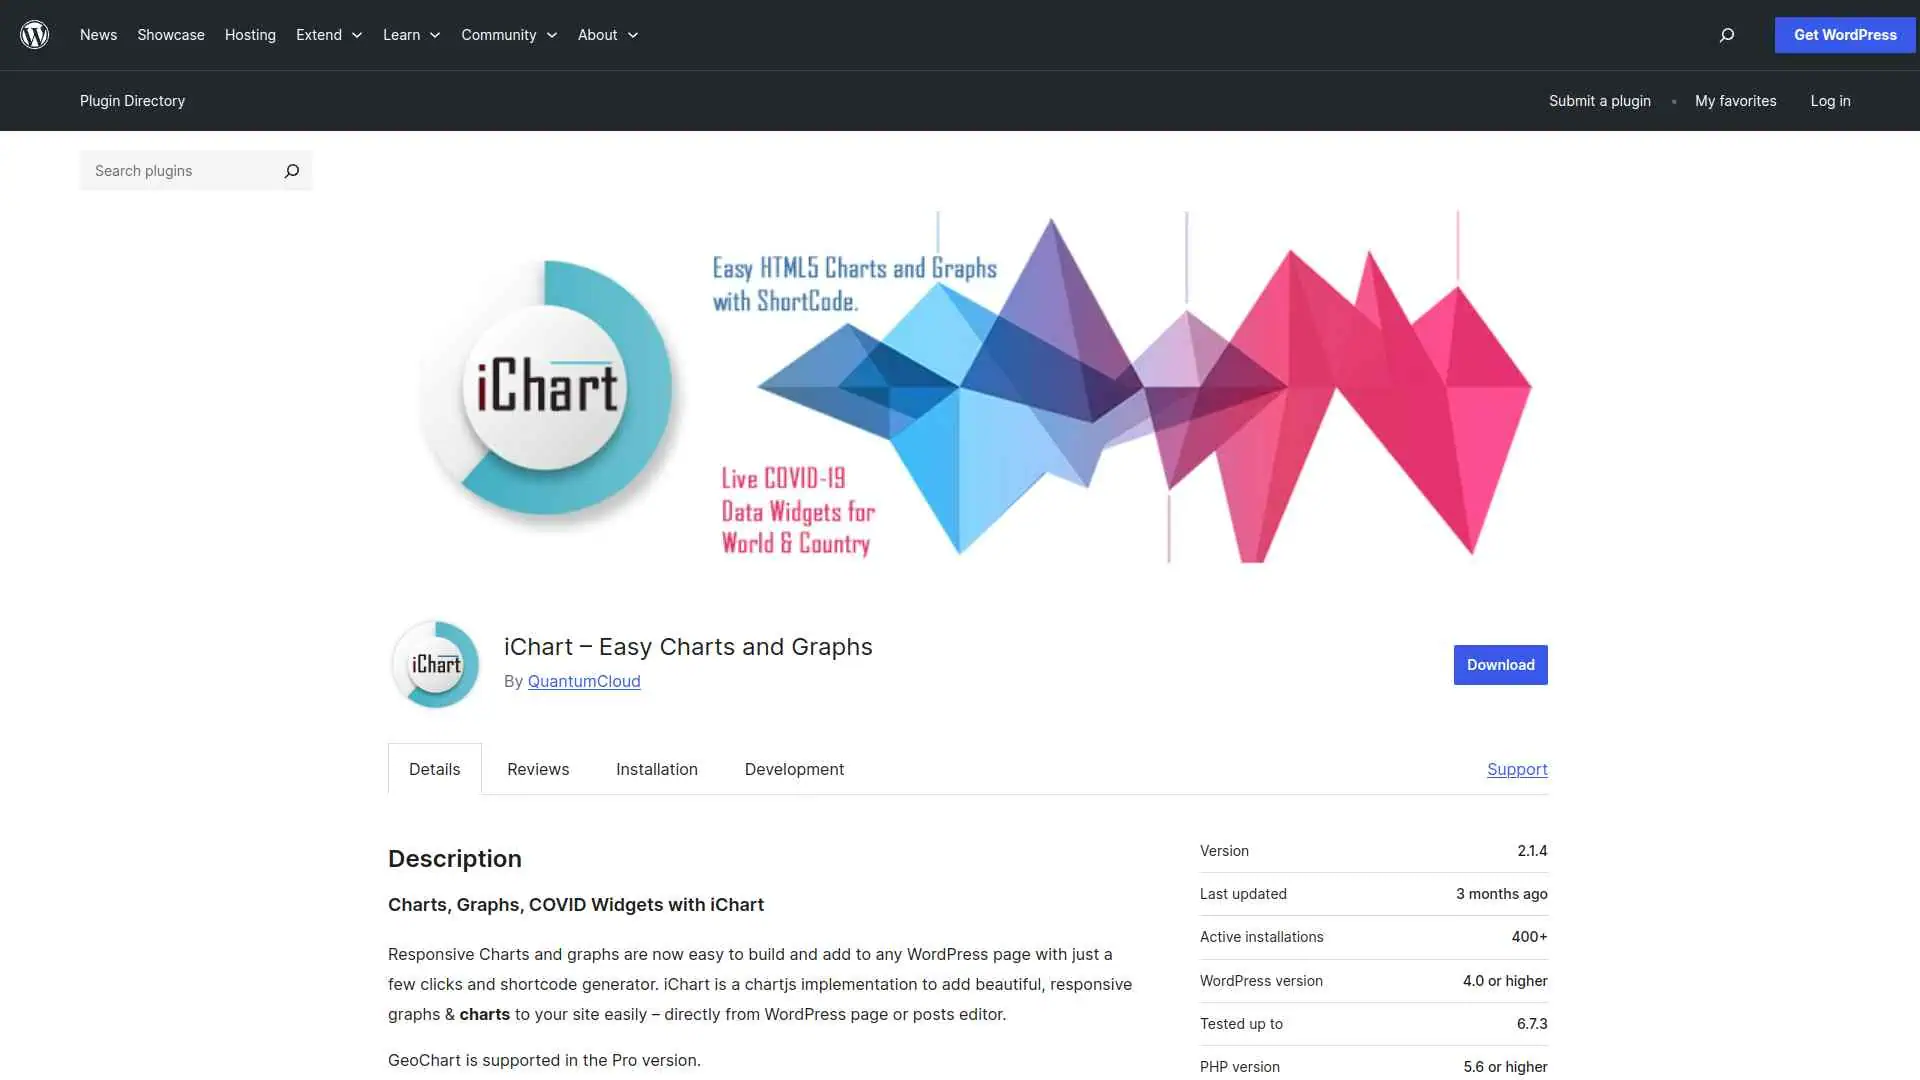
You can easily create beautiful, responsive charts and graphs directly within your WordPress posts or pages using the iChart plugin.
It offers a shortcode generator and Gutenberg block to quickly embed various chart types like pie, bar, line, and more.
Key Features of iChart
- Easily create beautiful, responsive charts and graphs directly within your WordPress posts or pages without needing coding skills.
- Quickly generate and embed multiple types of charts (like pie, bar, line, radar) to make your data visually engaging and easy to understand.
- Customize chart colors, sizes, and styles to match your website’s look and highlight important data clearly.
- Use the shortcode generator and Gutenberg blocks for fast, hassle-free chart creation and editing right from your WordPress editor.
3. Easy Charts
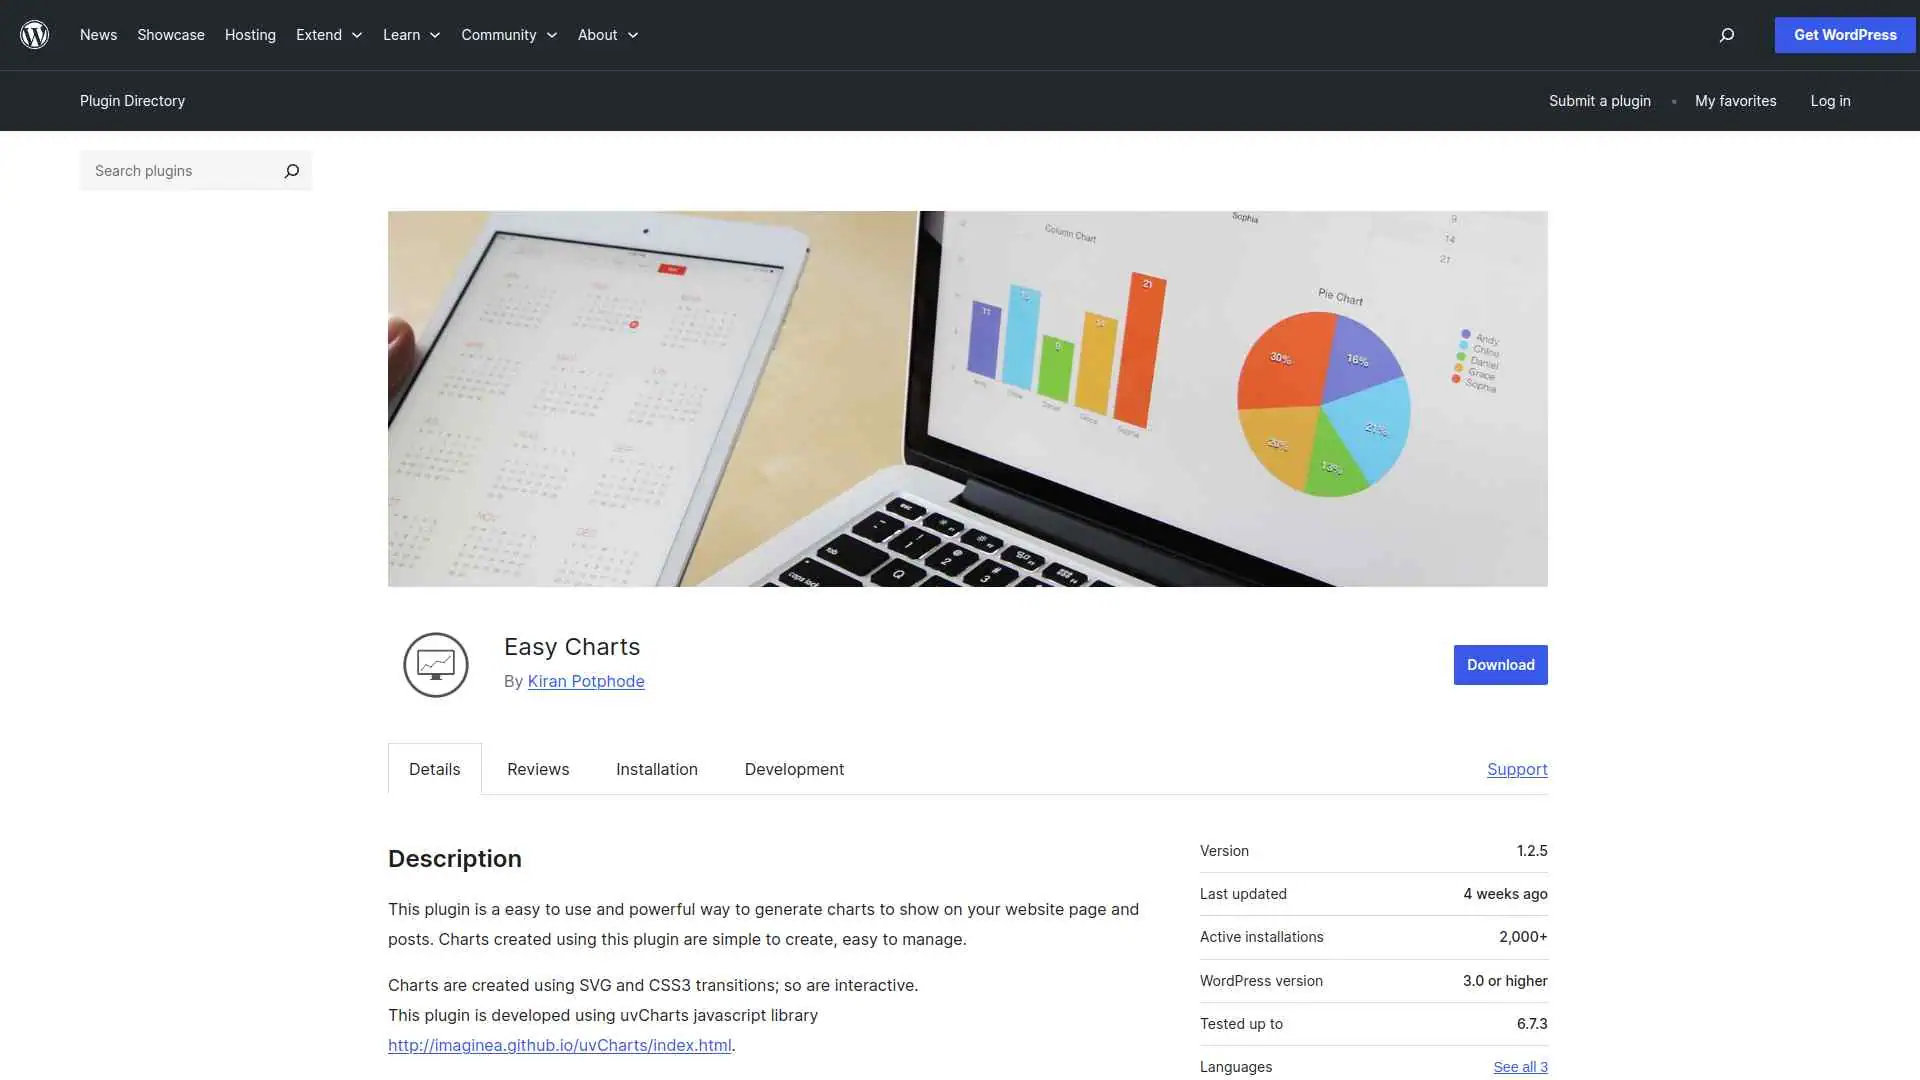
You can easily create and manage interactive, customizable charts on your WordPress site using the Easy Charts plugin.
It supports many chart types, offers live previews, and lets you embed charts quickly with shortcodes or a visual editor button.
Key Features of Easy Charts
- Easily create and customize interactive charts to make your website content more engaging and visually appealing.
- Manage your chart data with a simple, Excel-like interface, making updates quick and hassle-free.
- Embed multiple charts anywhere on your posts or pages using straightforward shortcodes or a visual editor button.
- Download your charts as images and enjoy responsive designs that look great on all devices.
4. Chartify
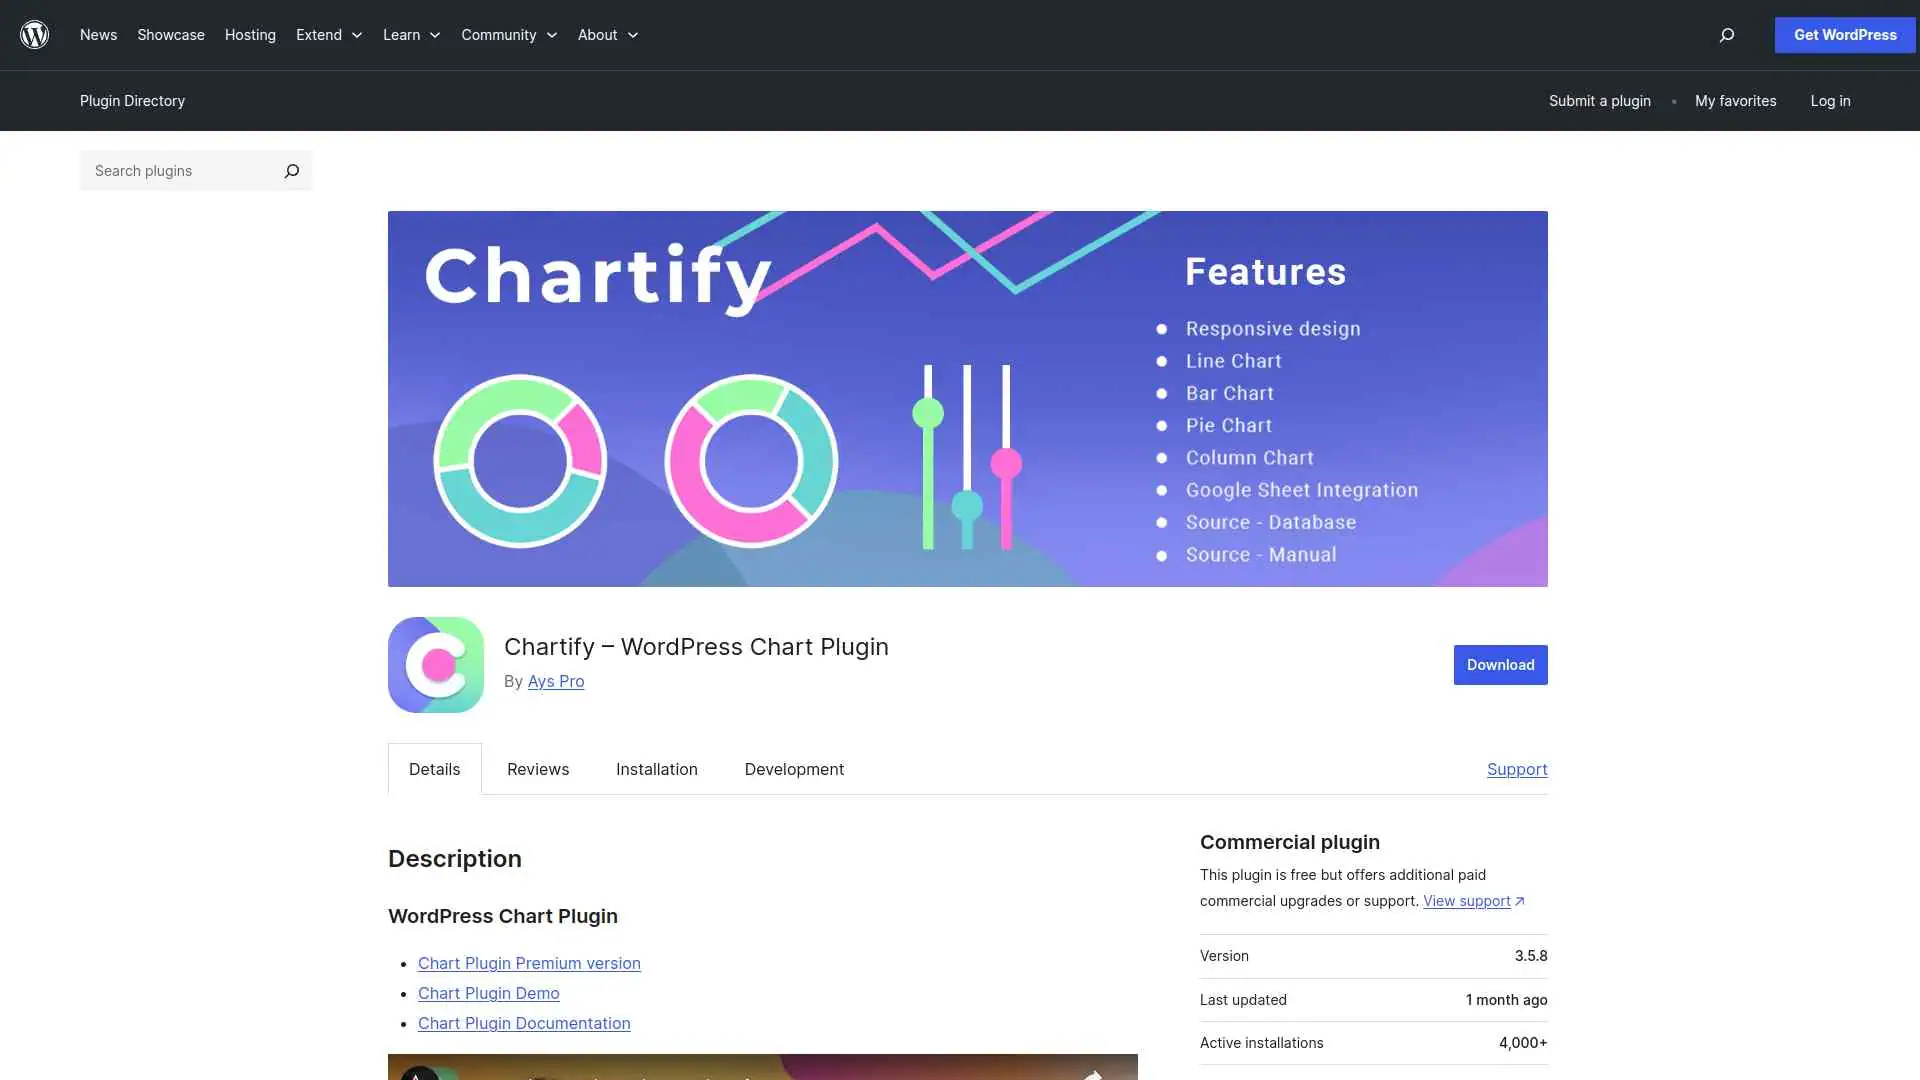
With the Chartify WordPress plugin, you can easily create responsive and dynamic charts by manually entering data, linking to Google Sheets, or querying your database.
You’ll enjoy over 20 chart types, live previews, and seamless shortcode embedding to make your site visually engaging.
Key Features of Chartify
- Easily create attractive and professional charts without any coding skills, making your website more engaging.
- Automatically update charts by linking to Google Sheets, so your data stays current without extra effort.
- Visualize quiz results and other data interactively to better understand and share insights with your audience.
- Use a wide variety of chart types to present your information clearly, helping visitors quickly grasp your key messages.
5. WP Charts and Graphs
The WP Charts and Graphs plugin lets you easily create responsive, interactive charts with a live preview right in your WordPress admin.
You simply enter titles and values, choose a chart type, and generate a shortcode to embed on any page or post.
Key Features of WP Charts and Graphs
- Easily create and customize beautiful charts directly from your WordPress admin without needing coding skills.
- Instantly preview your charts before publishing to ensure they look perfect on your site.
- Use a variety of chart types (like pie, bar, line, radar) to present your data in the most engaging way.
- Responsive design ensures your charts look great on all devices, including mobile phones and tablets.
Stay updated with Helpful WordPress Tips, Insider Insights, and Exclusive Updates – Subscribe now to keep up with Everything Happening on WordPress!
Which WordPress Pie Chart Plugin Should You Use?
When choosing a pie chart plugin, focus on ease of use, customization, and performance.
You want a tool that makes your data look professional without slowing down your site.

If you’re looking for the perfect balance of design and functionality, Pie Chart by Nexter is your best choice.
FAQs on Best Pie Chart Plugins for WordPress
Can I add a pie chart in WordPress without coding?
Yes, you can. Most WordPress pie chart plugins let you create and embed charts using simple visual editors. You just enter your data, customize the design, and insert the chart into posts or pages with a shortcode or block.
Do pie chart plugins work with the Gutenberg editor?
Yes, many plugins integrate directly with Gutenberg. You can add pie charts as blocks, making it easy to design and edit them visually without leaving the editor.
Are WordPress pie charts mobile-friendly?
Most modern plugins create responsive charts that adjust to screen sizes. This ensures your pie charts look good and remain readable on desktops, tablets, and smartphones.
Can I style the colors and labels of my pie chart?
Absolutely. Pie chart plugins usually offer customization options for colors, labels, tooltips, and legends. You can match the chart design with your site’s branding for a consistent look.
Do I need to prepare data in Excel before using a pie chart plugin?
Not necessarily. Many plugins let you enter data directly inside WordPress. However, some also support importing CSV or Excel files if you already have your data prepared.

